Comparative Cheminformatic Analysis of Inhibitors of DNA Methyltransferases
Oscar Palomino-Hernández and José L. Medina-Franco.
DOI10.21767/2470-6973.100025
Oscar Palomino-Hernández and José L. Medina-Franco*
School of Chemistry, Department of Pharmacy, Universidad Nacional Autónoma de México, Avenida Universidad 3000, Mexico City 04510, Mexico
- *Corresponding Author:
- Jose L Medina Franco
School of Chemistry, Department of Pharmacy
Universidad Nacional Autónoma de México
Avenida Universidad 3000, Mexico City 04510, Mexico.
Tel: +441454325530
E-mail: jose.medina.franco@gmail.com (or) medinajl@unam.mx
Received Date: November 29, 2017; Accepted Date: December 04, 2017; Published Date: December 09, 2017
Citation: Franco JLM, Hernández OP (2017) Comparative Cheminformatic Analysis of Inhibitors of DNA Methyltransferases. Chem Inform Vol. 3 No. 2:4. DOI: 10.21767/2470-6973.100025
Abstract
DNA methylation is an epigenetic mechanism mediated by a family of the enzymes DNA methyltransferases (DNMTs): DNMT1, DNMT3A and DNMT3B. These enzymes are emerging targets for the treatment of cancer and other diseases. Over the past few years several inhibitors of the three enzymes have been reported. Herein, we present a comprehensive chemoinformatic characterization of data sets of inhibitors of DNMT1, DNMT3A and DNMT3B assembled in this work. The compound data sets were analyzed in terms of physicochemical properties, structural fingerprints, and molecular scaffolds. As part of the characterization, a scaffold enrichment analysis was performed as well as visual representation of the chemical space. It was found that inhibitors of DNMT1 are the most diverse covering a broad area of the chemical space. Scaffold diversity analysis showed that inhibitors of DNMT1 and DNMT3A have a larger number of molecular scaffolds as compared to DNMT3B. It was also concluded that for all inhibitors there are molecular scaffolds enriched with active molecules and thus represent promising starting points for additional drug development.
https://maviyolculuk.online/
https://mavitur.online/
https://marmaristeknekirala.com.tr
https://tekneturumarmaris.com.tr
https://bodrumteknekirala.com.tr
https://gocekteknekirala.com.tr
https://fethiyeteknekirala.com.tr
Keywords
Chemical space; Epi-informatics; Epigenetics; Molecular scaffolds; Structure-activity relationships
Introduction
DNA methylation has been identified as a key epigenetic modification responsible for several biological processes including cell differentiation and development, DNA instability, and cancer development [1]. Aberrant methylation patterns are involved in tumor transformation and progression, thus indicating that these epigenetic disruptions are associated with tumorigenesis [2]. This methylation patterns are not stochastic, as they tend to silence tumor suppressor genes. Thus, inhibition of these abnormal methylation levels has been sought as a strategy to reactivate tumor suppressor genes [3,4].
DNA methylation is carried out by DNA-methyltransferases (DNMTs), which donate a methyl group from S-adenosylmethionine (SAM) to the fifth position of cytosine [5]. The enzymes DNMT1, DNMT3A and DNMT3B possess this catalytic ability in mammals [6]. In particular, DNMT1 is responsible for methylating partially methylated DNA strands and thus this it is responsible for DNA-methylation maintenance, whereas DNMT3A and DNMT3B participate in both maintenance and de novo DNA methylation [7].
As of now, the most attractive approach for treating hypermethylation-based cancer is the inhibition of DNA methyl transferases [4,8]. To date, the Food and Drug Administration of the United States has approved two drugs that target DNMTs: azacitidine and decitabine, both for myelodysplastic syndromes [9]. However, these drugs act as covalent inhibitors and are associated with several unwanted effects. Therefore, the design and development of non-covalent DNMT inhibitors is still on the rise [4,10].
Previous studies of the chemical space of epigenetic compounds have been performed [11,12]. However, these studies do not delve further into the molecular differences between the three DNMTs. Moreover, several inhibitors of DNMTs have been recently published and there are not comparative studies regarding their chemical structures and properties. Herein, we report a comprehensive cheminformatic characterization of compound data sets with inhibitors of DNMT1, DNMT3A, and DNMT3B. The characterization was based on physicochemical properties of pharmaceutical relevance, molecular fingerprints, and molecular scaffolds.
Methods
Data sets
A compound database of inhibitors for all three DNMTs was assembled by collecting information from ChEMBL [13], BindingDB [14] and HEMD [15]. Additional searching was done in Web of Science and SciFinder focusing on papers published from 2010 to the time of writing (November 2017). The curation of the datasets was performed in Molecular Operating Environment (MOE) using a published protocol [16,17]. Briefly, a linear notation canonical structure (InChI and SMILES) was obtained for each molecule. Then, molecules were prepared by keeping the largest molecular fragment, removing metals, neutralizing protonation states, and removing duplicates. For identical compounds with close but different activity values, the mean activity value was kept. After data curation, the data sets had 351 unique molecules for DNMT1, 192 for DNMT3A and 86 for DNMT3B.
Several compounds reported for DNMT3A and DNMT3B only had annotated percentages of inhibition. To be able to compare different activity measures, a manual binning of continuous data was performed based on a heuristic criterion: compounds were distributed into four classes (numbered 1-4) as follows: potentially very active, active, inactive, and potentially very inactive. For this analysis, the boundaries were: class 4 if the pIC50 was larger than 5.5, or inhibition value was larger than 75%; class 3 if the pIC50 was larger than 5, or inhibition value was larger than 50%; class 2 if the pIC50 was larger than 4, or inhibition value was larger than 25%; and class 1 if the pIC50 was lower than 4, or inhibition value was lower than 25%.
Distribution of relevant chemical properties
Relevant chemical descriptors were computed using MOE and R Core Team utilities [18] in RStudio [19]. Six molecular properties of pharmaceutical interest were computed [20,21]: partition coefficient octanol/water (logP), rotatable bonds (RB), hydrogenbond donors (HBD), hydrogen-bond acceptors (HBA), topological polar surface area (TPSA), and molecular weight (MW). Six additional topological descriptors were calculated: Plane of Best Fit, globularity, fraction of sp3 carbons, mass density, radius of Gyration and Wiener Index. For most of these descriptors, a lowenergy conformation was used. Data visualization was done using RStudio.
Statistical analysis: The statistical comparison of the descriptors was carried in RStudio with R Core Team and the lawstat, PMCMR, and dunn.test packages. The statistical analysis were a Shapiro test to determine normality of distributions, a Levene test for the evaluation of heteroskedacity of the descriptors, a Kruskal-Wallis test as a non-parametric ANOVA, and Dunn test for post-hoc testing. To assess the impact of heteroskedacity of the distribution of chemical properties, the variance of the distributions for the three libraries was obtained.
Correlation analysis: In order to analyze if the tendency among descriptors is constant within the library, a correlation analysis for detecting subtle differences was used. The correlation between two descriptors X1 and X2 was computed using the Pearson product-moment correlation coefficient. For this analysis, the three compound data sets were divided into active and inactive subsets. A correlation analysis was performed generating a correlation matrix for each subset. A Hadamard product was performed for the two matrices, obtaining a matrix with r2 value for each correlation.
Fingerprint-based diversity
The similarity for all pair of compound in a database was computed using three distinct molecular fingerprints: Molecular Access System (MACCS) keys, Extended Connectivity Fingerprints (ECFP, radius 4), and PubChem fingerprints. The similarity coefficient for fingerprint comparison was the Tanimoto/Jaccard index [22]. The distribution of the similarity values was analyzed with cumulative distribution functions (CDF).
To analyze inter-set similarity, the similarity of a compound in a given set was computed against all the compounds in the other set. The mean and maximum similarity values were recorded and multi-fusion similarity maps [23] were generated.
Scaffold content and diversity
Using the Bemis and Murcko's approach [24] the side chains from the molecules were removed and the molecular scaffold for each molecule was obtained. A unique identifier for each scaffold was assigned with RStudio.
Scaffold enrichment
The molecular scaffolds present in each of the three data sets were classified in terms of their intrinsic activity. Considering a given data set C with n elements and with λ different scaffolds (chemotypes), the intrinsic activity for the λ-th specific chemotype Cλ was calculated as [25]:
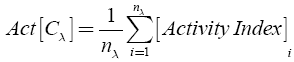
where nλ is the number of molecules included in the chemotype λ.
The background activity of the data set C was calculated as:
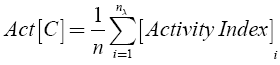
where n is the total number of compounds in the set.
The enrichment factor (EF) for the λ-th specific chemotype was then calculated as:
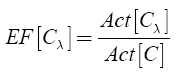
EF indicates how many times a scaffold λ is more active than the mean activity of the compound data set. Thus, scaffolds high EF values are attractive for drug discovery.
Visual representation of chemical space
Visual representations of the chemical space were performed using principal components analysis (PCA) and self-organizing maps (SOMs). Preprocessing of the data was performed using the caret package in RStudio. The visualization of the first PCs and the respective loadings was performed in RStudio with the ggplot2 package. The features used for these methods were the computed chemical descriptors and molecular fingerprints.
Results
Data set creation and curation
Table 1 shows the distribution of the activity values of the three data sets e.g., inhibitors of DNMT1, DNMT3A, and DNMT3B. Results in Table 1 indicate that, in general, more active compounds have been identified for DNMT1 as compared to DNMT3A and 3B (e.g., larger number of compound in activity class 4). This result may be related to the larger number of compounds developed for DNMT1.
| Library | Size (n)a | n (IC50)a | n (%)a | n (class4)b | n (class 3) | n (class 2) | n (class 1) |
|---|---|---|---|---|---|---|---|
| DNMT1 | 350 | 350 | - | 40 (11.5%) | 157 (45%) | 106 (30%) | 47 (13.5%) |
| DNMT3A | 190 | 35 | 155 | 28 (15%) | 24 (12.5%) | 42 (22%) | 96 (50.5%) |
| DNMT3B | 86 | 61 | 25 | 17 (20%) | 8 (9%) | 23 (27%) | 38 (44%) |
aSize, total number of compounds; n(IC50), number of compounds with IC50 values; n (%), number of compounds with activity data as percentage. bActivity classes: Class 4 if pIC50 was larger than 5.5, or inhibition value was larger than 75%; Class 3 if pIC50 was larger than 5, or inhibition value was larger than 50%; Class 2 if pIC50 was larger than 4, or inhibition value was larger than 25%, and Class 1 if pIC50 was lower than 4, or inhibition value was lower than 25%.
Table 1: Distribution of the activity values of the inhibitors of DNMT1, 3A and 3B considered in this work. The percentage is relative to the total elements in each data set.
Distribution of relevant chemical properties
Figure 1 shows the distribution of the six properties of pharmaceutical relevance (log P, RB, HBD, HBA, TPSA, and MW). The distributions are shown as a combination of boxplots and violin plots. The figure suggests that the sets of inhibitors of DNMT1 and DNMT3A have similar distributions of HBD and HBA, while DNMT3B has slightly higher values. All sets have comparable distributions of RB. Compounds in the DNMT3B set are slightly less lipophilic (lower logP values) than the other two sets. Regarding TPSA, inhibitors of DNMT1 cover a large range of values, while inhibitors of DNMT3A are centered near the mean of the distribution. The median TPSA values for DNMT3B inhibitors is higher than for the other two sets. Figure 1 also indicates that all three data sets have comparable distribution of MW.

Figure 1: Distribution of pharmaceutical properties of pharmaceutical relevance.
Figure 2 shows the distribution of selected topological descriptors. Some of the topological descriptors showed small differences between the data sets, as illustrated by the distributions of Plane of Best Fit Index and Globularity. It appears that inhibitors of DNMT3A tend to have a larger volume, as evidenced by the higher values of radius of gyration, Wiener index, and lower mass density. Inhibitors of DNMT3B tend to have higher values of fraction of sp3 atoms than the other sets.

Figure 2: Boxplots and violin plots of topological descriptors.
The distribution of the molecular properties was also analyzed considering the four activity classes of each set. For DNMT1, active compounds tend to have higher values of HBD. For DNMT3A, the inactive compounds tend to have lower values of HBD while the actives have larger values of HBA, RB, log P, and MW. For DNMT3B, the most active compounds tend to have higher values of HBA, HBD, RB, MW and TPSA. Also, the most active compounds are less lipophilic with lower values of log P.
For most topological descriptors there was no relevant difference. Overall, inactive compounds tend to have higher values of globularity and fraction of sp3 atoms that the other data sets. Some topological descriptors also show that active compounds for DNMT3B have a high Wiener Index, high mass density, a high fraction of sp3 carbons, and a high radius of gyration.
Statistical analysis: Only the distribution of MW for DNMT1, RG for DNMT3B, and PBF for DNMT3A and DNMT3B had p-values larger than 0.05, indicating that most of the distributions of chemical descriptors for the three enzymes deviate from normality. The Levene test indicated that only RB, MW, PBF and Glob could be considered as having similar variances, rendering the other distributions of descriptors as heteroskedastic, but without high heteroskedastic effects (see Methods). The Kruskal-Wallis analysis indicated that only MW and Glob had similar ranks for the three proteins. The post-hoc Dunn test indicated that between DNMT1 and DNMT3A only HBA and HBD were comparable, while for DNMT1 and DNMT3B Wiener Index and RG had larger p- values than 0.05. Comparing DNMT3A and DNMT3B, only PBF had similar ranks. These results suggested that, in general, the distributions of chemical properties of the three data sets show significant differences.
Correlation analysis: For the three data sets of inhibitors of DNMT1, 3A and 3B compounds were considered active if they had an activity index of 3 or 4, and inactive otherwise. The results of the correlation analysis indicate that the DNMTs show different tendencies between active and inactive subsets in several chemical descriptor. In particular, HBD and radius of gyration showed negative correlation between active and inactive subsets of DNMT3A and DNMT3B, which indicates that this descriptor pair is able to discriminate between active and inactive molecules. For the cross-correlation, HBD and Wiener index were able to distinguish active subsets of DNMT1 and DNMT3A.
Fingerprint-based diversity
Intra-set comparisons: Figure 3 shows the CDF of the pairwise similarity for all the compounds in the DNMT1, 3A, and 3B sets computed with the Tanimoto coefficient and three different fingerprints (see the Methods section). Table 2 summarizes representative statistics of the distributions.
| DNMT1 | DNMT3A | DNMT3B | |||||||
|---|---|---|---|---|---|---|---|---|---|
| MACCS | PubChem | ECFP4 | MACCS | PubChem | ECFP4 | MACCS | PubChem | ECFP4 | |
| Min. | 0.00 | 0.04 | 0.00 | 0.12 | 0.12 | 0.03 | 0.10 | 0.10 | 0.00 |
| 1st Qu. | 0.34 | 0.35 | 0.09 | 0.35 | 0.42 | 0.11 | 0.29 | 0.26 | 0.09 |
| Median | 0.43 | 0.44 | 0.11 | 0.44 | 0.49 | 0.15 | 0.54 | 0.42 | 0.14 |
| Mean | 0.43 | 0.44 | 0.13 | 0.46 | 0.52 | 0.19 | 0.57 | 0.50 | 0.25 |
| 3rd Qu. | 0.52 | 0.54 | 0.14 | 0.51 | 0.61 | 0.19 | 0.86 | 0.74 | 0.42 |
| Max. | 1.00 | 1.00 | 1.00 | 1.00 | 1.00 | 1.00 | 1.00 | 1.00 | 1.00 |
| SD. | 0.14 | 0.15 | 0.08 | 0.16 | 0.16 | 0.15 | 0.27 | 0.28 | 0.22 |
aQu, quartile; SD, standard deviation.
Table 2: Statistics of pairwise similarity distributions computed with three fingerprints and the Tanimoto coefficient.a

Figure 3: Empirical cumulative distribution functions for the pairwise similarity of compounds in the three data sets calculated with the Tanimoto coefficient and MACCS keys, ECFP4, and PubChem FP.
According to MACCS keys, both DNMT1 and DNMT3A have similar diversity. DNMT3B shows, in general, higher quantile values and higher standard deviation, indicating that compounds in the DNMT3B set are less diverse. According to PubChem and ECFP4 fingerprints, DNMT1 is the most diverse set and DNMT3A is the least diverse. The larger diversity of DNMT1 can be associated with the larger amount of compounds in this set. Interestingly, Pubchem and ECFP4 fingerprints were able to differentiate the data sets. This is associated with the better resolution of these fingerprints as compared to MACCS keys.
Inter-set comparisons: Multi-fusion similarity maps (Figure 4) were used to compare the data sets to each other based on fingerprints. When comparing the similarity values of DNMT3A and DNMT3B with DNMT1 as the reference set, DNMT3B tends to cluster in the left bottom area of the plot, with the largest values of mean fusión similarity and the lowest values of max fusion similarity. In contrast, DNMT3A covers a broader area regarding the maximum fusion value. This result indicates that there is a smooth structural overlap between compounds of DNMT3A with DNMT1, while DNMT3B is overall less similar to DNMT1. Taking DNMT3A as reference (Figure 4, middle), DNMT1 and DNMT3B have comparable distribution in the multi-fusion similarity map, with some compounds in the DNMT3B set with higher values of mean fusion similarity. The map indicated that most of the molecules in DNMT1 and DNMT3B have, on average, a value of c.a. 0.13 of similarity when compared to DNMT3A, but some compounds in the DNMT3B set are more similar. Considering DNMT3B as reference (Figure 4), the DNMT1 set has lower values of maximum fusion similarity. This result indicates proximity between the compoubds of DNMT3A with respect to DNMT3B, and the higher distance between compounds of DNMT1 and DNMT3B.

Figure 4: Multi-fusion similarity maps with DNMT1, DNMT3A, and DNMT3B as reference data sets.
Scaffold content, diversity and enrichment
Scaffold content: Figure 5 shows the three most frequent scaffolds retrieved for each data set. In agreement with previous scaffold content analysis [16], most of the scaffolds identified in this work were previously found such as SCAFF78, SCAFF75 and SCAFF7. However, additional interesting scaffolds were identified (vide infra).

Figure 5: Most frequent scaffolds found in the three sets. The frequency and percentage relative to all scaffolds in the data set are indicated. ’Ph’ = phenyl ring.
Scaffold diversity: For each set of inhibitors of DNMT1, 3A, and 3B, the scaffold diversity analysis was done for three sub-sets. The sub-sets were organized based on the reported activity as inactive (intrinsic activity lower than 2), intermediate (intrinsic activity equal or higher than 2, but lower than 3), and active (intrinsic activity equal or higher than 3). Scaffold recovery curves were obtained for each of the nine sub-groups (Figure 6). Table 3 summarizes the results of scaffold diversity for each sub group as determined by different metrics [26].
| Library | Set | M | N | Nsing | N/M | Nsing/M | Nsing/N | f50 | AUC | Median(ECFP4) |
|---|---|---|---|---|---|---|---|---|---|---|
| Inactive | 127 | 107 | 93 | 0.84 | 0.73 | 0.87 | 0.411 | 0.570 | 0.1014 | |
| DNMT1 | Intermediate | 179 | 123 | 99 | 0.69 | 0.55 | 0.80 | 0.276 | 0.640 | 0.1053 |
| Active | 44 | 28 | 22 | 0.64 | 0.50 | 0.79 | 0.214 | 0.656 | 0.0978 | |
| Inactive | 138 | 68 | 51 | 0.49 | 0.37 | 0.75 | 0.117 | 0.728 | 0.1465 | |
| DNMT3A | Intermediate | 22 | 15 | 10 | 0.68 | 0.45 | 0.67 | 0.333 | 0.618 | 0.2115 |
| Active | 30 | 18 | 16 | 0.60 | 0.53 | 0.89 | 0.167 | 0.681 | 0.2187 | |
| Inactive | 39 | 21 | 16 | 0.54 | 0.41 | 0.76 | 0.190 | 0.703 | 0.0750 | |
| DNMT3B | Intermediate | 37 | 10 | 6 | 0.27 | 0.16 | 0.60 | 0.200 | 0.701 | 0.1379 |
| Active | 10 | 7 | 5 | 0.70 | 0.50 | 0.71 | 0.286 | 0.614 | 0.3793 |
N: number of cyclic systems; M: number of molecules; Nsing: number of singletons; f50: fraction of cyclic systems that contains 50% of the data set; AUC: area under the curve
Table 3: Summary table for metrics of scaffold diversity of each DNMT.

Figure 6: Scaffold recovery curves for DNMT1 (left), DNMT3A (center), and DNMT3B (right), analyzed in terms of highly active scaffolds (3-4), moderately active scaffolds (2-3), and inactive scaffolds (1-2).
The scaffold analysis revealed that inhibitors of DNMT1 have a high scaffold diversity, in particular the inactive subset (Table 3). In contrast, the active sub-set of DNMT1 is the least diverse. For DNMT3A, the active set and compounds with intermediate activity showed, in general, larger scaffold diversity than the inactive compounds. For DNMT3B, the active set had the largest scaffold diversity. When comparing the active-scaffold subsets from the three enzymes, diversity measures indicated that DNMT3B is the most diverse, followed by DNMT1 and DNMT3A.
Scaffold enrichment: Chemotype-enrichment plots [25] were generated for each set by plotting the scaffold frequency vs. the EF (see the Methods section). The chemotype-enrichment plots are shown in Figure 7.

Figure 7: Chemotype-enrichment plots for DNMT1, DNMT3A, and DNMT3B.
For DNMT1, nearly 55% of the chemotypes have EF values larger than one. The three most frequent scaffolds are SCAFF75, SCAFF78 and SCAFF7 (Figure 5). For DNMT3A, 61% of the chemotypes have EF values higher than one. In contrast, for DNMT3B, only 44% of the chemotypes have values larger than one. These results indicated that DNMT3A has been explored more in terms of scaffolds given that it has chemotypes with high frequency and high EF. This figure also shows the existence of some chemotypes with high values of EF and low values of frequency, which could indicate areas of opportunity regarding the development of new SAR studies for the three DNMTs.
Figure 8 shows additional attractive scaffolds: SCAFF254 and SCAFF109 has selectivity for DNMT1; SCAFF266 has high EF for DNMT3A; SCAFF237 has high EF for all three DNMTs.

Figure 8: Other representative scaffolds in the datasets (Ph=Phenyl, Qu=Quinoline, Pyr=Pyrimidine). For each scaffold is shown the enrichment factor and scaffold frequency (in parenthesis).
SAR analysis based on selected scaffolds: Analysis of cofactorrelated scaffolds revealed that a substructure of SCAFF78 was present in several chemotypes. Thus, considering SCAFF78 as reference, the EF values were used as a guide to explore selectivity among the three DNMTs. Figure 9 shows the core nucleosidic scaffold with two side chains, R1 and R2. For this analysis, we used scaffolds with a chemotype frequency equal or larger than three.

Figure 9: Scaffolds found in the dataset, with the maximum common substructure of SCAFF78 (Ph=Phenyl, Bi=Biphenyl).
Taking the EF of SCAFF78 as a baseline (0.89 for DNMT1, 1.56 for DNMT3A and 1.2 for DNMT3B), and leaving R2 fixed as a hydrogen, it was found that when R1=2, the EF improved substantially for DNMT3B (1.18 for DNMT1 and 1.6 for DNMT3B). When R1=3, the EF decreased for DNMT1 while improving for DNMT3B (0.78 for DNMT1 and 1.9 for DNMT3B). This suggests that elongating the side chain of the scaffold can improve selectivity for DNMT3B against DNMT1. Keeping fixed R1=1, it was found that the substitution R2=A (Figure 9) did not improve the EF (0.96 for DNMT1 and 1.05 for DNMT3B). The substitution R2=B decreased the EF for DNMT1 while being similar for DNMT3B (0.65 for DNMT1 and 1.09 for DNMT3B). The substitution R2=C diminished overall the EF (0.78 for DNMT1 and 0.73 for DNMT3B). These results suggest that a longer linker in R2 tends to decrease the overall activity, and that keeping a constrained cycle of six can also favor selectivity for DNMT3B against DNMT1. These results can be found combined in SCAFF77, which has R1=3 and R2=A, and has an EF for DNMT1 of 1.18 and for DNMT3B of 1.45, implying that the previous effects cannot interact in synergy. Finally, it was also noted that removing the nitrogen atom marked with the electron pair can increase both EF of DNMT1 and DNMT3B to 1.57 and 1.94, respectively.
Visual representation of the chemical space
Figure 10 shows a visual representation of the chemical space based on PCA of six properties of pharmaceutical relevance i.e., HBA, HBD, TPSA, RB, logP and MW. The first principal component is largely associated with TPSA, HBA and HBD, while the second principal component is associated with RB, MW, and LOGP. Figure 10 shows that the three data sets share a common space, with DNMT1 inhibitors being the most diverse. When analyzing only the most active compounds (Figure 10) - compounds with activity index equal or greater than 3 – the three active subsets appear to cluster in different regions of the chemical space.

Figure 10: Visualization of the chemical space based on oral availability descriptors (MW, logP, RB, TPSA, HBD and HBA) and a principal component analysis. Left: All compounds. Center: Only active compounds (activity index equal or greater than 3). Right: Only inactive compounds (activity index lower than 3).
Figure 11 shows a visualization of the chemical space based on SOM. In this plot, inactive compounds in the three sets tend to span over the map. However, when showing only the active compounds (active index equal or greater than 3), it shows that active compounds of DNMT3A and DNMT3B are not covering the same chemical space.

Figure 11: Visualization of the chemical space based on oral availability descriptors (MW, logP, RB, TPSA, HBD and HBA) projected on a self-organizing map. Top: only inactive compounds. Bottom: only active compounds.
Conclusions
A global cheminformatic comparison of three data sets of inhibitors of DNMT1, DNMT3A and DNMT3B is reported in this work. Analysis of physicochemical properties and molecular diversity based on fingerprints showed that inhibitors of DNMT1 cover broader areas of the chemical space. In contrast, DNMT3A and DNMT3B cover smaller areas. Analysis with topological descriptors revealed that inhibitors of DNMT3A have larger volume than inhibitors of DNMT1 and 3B. Inhibitors of DNMT3B also had higher values of fraction of sp3 atoms than the other sets. Visual representation of the chemical space revealed that all three sets of inhibitors of DNMT1, 3A and 3B share a common space. Scaffold diversity analysis indicated that inhibitors of DNMT1 and DNMT3A have a larger number of molecular scaffolds as compared to DNMT3B. For all three data sets, there are molecular scaffolds enriched with active molecules representing promising starting points for drug development.
Acknowledgments
This work was supported by the Universidad Nacional Autónoma de México (UNAM) grant ‘Programa de Apoyo a Proyectos de Investigación e Inovación Tecnológica’ (PAPIIT) IA204016. We also thank funding from the ‘Programa de Apoyo a la Investigación y el Posgrado’ (PAIP) 50009163, Facultad de Química, UNAM. OP-H is grateful to CONACyT for the fellowships granted No. 765897/606003.
References
- Robertson KD (2001) DNA methylation, methyltransferases, and cancer. Oncogene 20: 3139-3155.
- Zhang W, Xu J (2017) DNA methyltransferases and their roles in tumorigenesis. BiomarkerResearch 5:1.
- Liu K, Liu Y, Lau JL, Min J (2015) Epigenetic targets and drugdiscoveryPart 2: Histonedemethylation and DNA methylation. PharmacolTher 151: 121-140.
- Dueñas-González A, Jesús Naveja J, Medina-Franco JL (2016) Introductionofepigenetic targets in drugdiscovery and currentstatusofepi-drugs and epi-probes: Epi-Informatics. Boston: AcademicPress,pp: 1-20.
- Goll MG, Bestor TH (2005) Eukaryoticcytosinemethyltransferases. AnnuRevBiochem 74: 481-514.
- Valente S, Liu YW, Schnekenburger M, Zwergel C, Cosconati S, et al. (2014) Selective non-nucleosideinhibitorsof human DNA methyltransferases active in cancerincluding in cancerstemcells. J MedChem 57: 701-713.
- Jurkowska RZ, Jurkowski TP, Jeltsch A (2011) Structure and functionofmammalian DNA methyltransferases. ChemBioChem 12: 206-222.
- Xu P, Hu G, Luo C, Liang Z (2016) DNA methyltransferaseinhibitors: anupdatedpatentreview. Expert OpinTher Pat 26: 1017-1030.
- Hollenbach PW, Nguyen AN, Brady H, Williams M, Ning Y, et al. (2010) A comparisonofazacitidine and decitabineactivities in acutemyeloidleukemiacelllines. PLoSOne 5: e9001.
- Palomino-Hernandez O, Jardinez-Vera A, Medina-Franco J (2017) Progressonthecomputationaldevelopmentofepigeneticmodulatorsofdnamethyltransferases 3A and 3B. J Mex ChemSoc 61: 266- 272.
- Fernandez-de Gortari E, Medina-Franco JL (2015) Epigeneticrelevantchemicalspace: a chemoinformaticcharacterizationofinhibitorsof DNA methyltransferases. RSC Adv 5: 87465-87476.
- Prieto-Martinez FD, Gortari EF, Mendez-Lucio O, Medina-Franco JL (2016) A chemicalspaceodysseyofinhibitorsofhistonedeacetylases and bromodomains. RSC Adv 6: 56225-56239.
- Bento AP, Gaulton A, Hersey A, Bellis LJ, Chambers J, et al. (2014) TheChEMBLbioactivitydatabase: anupdate. NucleicAcids Res 42: D1083-D1090.
- Liu TQ, Lin YM, Wen X, Jorissen RN, Gilson MK (2007) BindingDB: a web-accessibledatabaseofexperimentallydeterminedprotein-ligandbindingaffinities. NuclAcids Res 35: D198-D201.
- Huang Z, Jiang H, Liu X, Chen Y, Wong J, et al. (2012) HEMD: Anintegratedtoolof human epigeneticenzymes and chemicalmodulatorsfortherapeutics. PLoSOne 7: e39917.
- Fourches D, Muratov E, Tropsha A (2010) Trust, butverify: ontheimportanceofchemicalstructurecuration in cheminformatics and QSAR modelingresearch. J ChemInfModel 50: 1189-1204.
- Molecular OperatingEnvironment (MOE) Version 2014.08, Chemical Computing Group Inc., Montreal, Quebec, Canada.
- R Development Core Team (2017) R: A language and environmentforstatisticalcomputing. R FoundationforStatistical Computing V, Austria.
- RStudioTeam (2016) RStudio: Integrateddevelopmentenvironmentfor R. RStudio I, Boston, MA, USA.
- Lipinski CA, Lombardo F, Dominy BW, Feeney PJ (1997) Experimental and computationalapproachestoestimatesolubility and permeability in drugdiscovery and developmentsettings. AdvDrugDeliveryRev 23: 3-25.
- Veber DF, Johnson SR, Cheng HY, Smith BR, Ward KW, et al. (2002) Molecular propertiesthatinfluencethe oral bioavailabilityofdrugcandidates. J MedChem 45: 2615-2623.
- Medina-Franco JL, Maggiora GM (2013) Molecular similarityanalysis: Chemoinformaticsfordrug Discovery.John Wiley &Sons, Inc. pp: 343-399.
- Medina-Franco JL, Maggiora GM, Giulianotti MA, Pinilla C, Houghten RA (2007) A similarity-based data- fusionapproachtothe visual characterization and comparisonofcompounddatabases. ChemBiolDrug Des 70: 393-412.
- Bemis GW, Murcko MA (1996) Thepropertiesofknowndrugs. 1. Molecular frameworks. J MedChem 39: 2887-2893.
- Medina-Franco JL, Petit J, Maggiora GM (2006) Hierarchicalstrategyforidentifying active chemotypeclasses in compounddatabases. ChemBiolDrug Des 67: 395-408.
- Medina-Franco JL, Martínez-Mayorga K, Bender A, Scior T (2009) Scaffolddiversityanalysisofcompound data sets usinganentropy-basedmeasure. QSAR CombSci 28: 1551-1560.

Open Access Journals
- Aquaculture & Veterinary Science
- Chemistry & Chemical Sciences
- Clinical Sciences
- Engineering
- General Science
- Genetics & Molecular Biology
- Health Care & Nursing
- Immunology & Microbiology
- Materials Science
- Mathematics & Physics
- Medical Sciences
- Neurology & Psychiatry
- Oncology & Cancer Science
- Pharmaceutical Sciences