Chaos Based Quantitative Risk Assessment of Cardiac Dysfunction
Rajib Sarkar, Anirban Bhaduri, Susmita Bhaduri and Dipak Ghosh
DOI10.21767/2470-6973.100018
Rajib Sarkar, Anirban Bhaduri, Susmita Bhaduri* and Dipak Ghosh
Deepa Ghosh Research Foundation, Maharaja Tagore Road, Kolkata, West Bengal, India
- *Corresponding Author:
- Susmita Bhaduri
3/1/1, Deepa Ghosh Research Foundation
Maharaja Tagore Road, Dhakuria Station Lane
Kolkata-700 031, West Bengal, India.
E-mail: susmita.sbhaduri@dgfoundation.in
Received Date: September 30, 2016; Accepted Date: October 19, 2016; Published Date: October 22, 2016
Citation: Sarkar R, Bhaduri A, Bhaduri S, et al. Chaos Based Quantitative Risk Assessment of Cardiac Dysfunction. Chem Inform. 2016, 2:2 doi: 10.21767/2470-6973.100018
Abstract
Congestive Heart Failure is a growing menace spreading its jaws worldwide. As for all diseases, early detection of the disease is the key to thwart the rampage caused by the disease. With the existent diagnostic devices and methodologies, cost of diagnosis is high and some are painful due to their invasive nature. This has led us to apply non-linear methods for analysis of ECG signals and formulate biomarkers.
Analysis of cardiac signals using fractal analysis has gained sufficient momentum over the past few years. In this article the cardiac dynamics of ECG data are explored with chaos based non-linear time series analysis techniques -- Hurst exponent and Power of scale freeness in Visibility Graph PSVG. The ECG data of normal subjects and CHF subjects are taken from Physionet [1] database and analyzed with these techniques to calculate values of Hurst Exponent and PSVG.
The Hurst exponent analysis reflects the chaotic behavior of normal and CHF patients’ heart and the PSVG parameter can significantly differentiate the CHF patients from normal people.
The parameters obtained by the non-linear analysis of ECG signals can be used as biomarkers. The biomarkers can be used by clinical laboratories as well as by smart phone users. Clinical software or mobile apps implementing the proposed method can be used for alarm generation during onset of cardiac abnormalities of the CHF patients.
Keywords
Congestive heart failure; Diagnosis; PSVG; Hurst; Biomarker
Introduction
Congestive heart failure is a condition in which the heart is unable to pump blood at a rate which is sufficient to meet the needs of different parts of the human body owing to the weakening of heart muscles. CHF may be brought about by coronary artery diseases, hypertension and valvular heart diseases [2,3]. The past history of heart attacks in a person (myocardial infarction) also becomes a factor in determining his/her susceptibility to CHF.
CHF is one of the major cardiovascular disorders [4] in the modern day world and may be attributed to a number of causes like sedentary lifestyles, poor dietary regimes, lack of physical exercise, obesity, smoking etc. CHF was found to affect approximately 23 million people worldwide in the year 2010 [5].
There is no proper diagnostic method which meets the gold standard for CHF. NICE (The National Institute for Health and Care Excellence) recommended measurement of B-type natriuretic peptide (BNP) and ultrasound of heart (echocardiogram) for CHF [6]. The American College of Cardiology (ACC) and American Heart Association (AHA) identified four stages of heart failure in 2001 [7]. According to their guideline, patients of stage A are at a high risk for developing CHF and patients of stage D are in a critical phase and require palliative care. The New York Heart Association (NYHA) guideline is also useful for classification of CHF [8].
A statistics published in 2008 shows that health expenditure associated with CHF was more than $29 billion in the United States alone [9].
An expert clinician can draw a lot of inferences regarding the health of the heart from electrocardiography (ECG) signals. Analysis of ECG signals is one of the major methods of diagnosis of CHF and other heart related problems. And for this reason, the study of heart rate dynamics is relevant in this context. Heart rate signal can be described as a periodic signal. The Fourier transform, a conventional technique for analysis of periodic signals, has been used for this purpose. The Fourier transform, which extracts the frequency spectrum from a periodic signal, however has some limitations as spurious harmonics are not taken into consideration. The transform considers the signal as a stationary signal, i.e., it assumes that the properties of the frequencies do not change across the entire signal. Also, the Fourier Transform requires the time series to be infinite. But heart rate time series is non-stationary in nature and collecting infinite heart rate signals for processing is not feasible for real time systems. To get significant performance, we need to use a suitable method which provides better precision and more accurate results with finite data points [10].
Some researchers have investigated the chaotic behavior of heart rate signals [11-14]. Natural signals like heart rate time series contain harmonic components and are non-stationary in nature. It can be inferred from the Ref. [15,16] that conventional methodologies for non-linear and non-stationary time series analysis introduce spurious harmonic components and, are therefore insufficient.
In the present investigation we have applied the Power of Scale-freeness of a Visibility Graph (PSVG) technique [17,18] and Hurst exponent [19] Multi-fractal Detrended Fluctuation Analysis (MFDFA) [20] for a quantitative assessment of cardiac dysfunction in case of CHF, the results of which are interesting and encouraging.
Our paper essentially reports the detailed analysis of heart beat time-series data. It was also our aim to propose ideas for development of a clinical tool for risk mitigation.
The paper is organized in the following manner. Section 2 describes our methods adopted in the context of chaos theory. Section 3 provides the description and source of the data and the analysis carried out on them and finally summarizes the results. The paper ends with a discussion and conclusion in 4.
Methods
Fractals and non-linear methods
The concept of fractal was introduced by Mandelbrot [21]. According to Mandelbrot, fractal is a geometric pattern which is repeated across diÃÆïÃâìÃâââ¬erent scales to produce self-similar, irregular shapes or surface. Natural objects like snowÃÆïÃâìÃâââ¬Å¡akes, trees, fern leaves, proÃÆïÃâìÃâÃÂle of a mountain etc. are fractals. Because magnifying a small portion of a snowflakes, produces similar geometrical figure like the snowflakes i.e., they are self-similar. Most important property of fractals is repetition of geometric pattern across diÃÆïÃâìÃâââ¬erent scales. For this reason, smaller or bigger fragments of a fractal system look very similar. This property is known as self-similarity. Fractal dimension is a ratio providing a statistical index of complexity, comparing how detail a fractal pattern changes with the scale. Fractals can be categorized into two types: mono fractals and multi fractals. For diÃÆïÃâìÃâââ¬erent regions of a fractal system, scaling properties are same for mono fractals. But multifractals are more complex in nature. They consist of diÃÆïÃâìÃâââ¬erent complicated fractal objects with diÃÆïÃâìÃâââ¬erent non-integer dimensions. So, a multifractal system’s scaling property varies for diÃÆïÃâìÃâââ¬erent regions. The calculation of fractal dimension that is measuring self-similarity is a major area in the field of study of chaos. There are several methods that have been proposed for measuring Fractal Dimension (FD) like- Spectral Analysis, Rescaled Range Analysis, Wavelet Transform Modulus Maxima (WTMM), Fluctuation Analysis (FA), Detrended Fluctuation Analysis (DFA), Detrended Moving Average (DMA), Multi-fractal Detrended Fluctuation Analysis (MF-DFA) and Hurst exponent, Power of Scale-freeness of a Visibility Graph (PSVG). In this work, we have tried to reflect the non-linearity of heart rate time series by PSVG and Hurst exponent methods.
Hurst exponent
The Hurst exponent estimates dimensionless self-similarity of a non-linear time series. Hurst exponent estimation originally developed for hydrology by Harold Edwin Hurst. Now it is established and popular in areas like applied mathematics, nonlinear time series and chaos theory, bio-physics, stock market and finance [22,23]. One of the best Hurst exponent estimation method suggested by Gloter and Hoffmann [24] is to first estimate the energy level of an octave of wavelet transform:
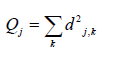
Where dj,k is the random wavelet coefficient of the time series X relative to a wavelet basis
 and calculated as :

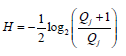
Now the Hurst exponent H is estimated from the following equation:
The Hurst exponent can be estimated from Fractal dimension (FD) from the relation:

The value of H lies in [0,1]. An estimation H>0.5 indicates persistent behavior i.e., the time series of long term positive auto correlation. Whereas H>0.5 indicates anti-persistent behavior of a time series i.e., long-term switching between high and low values in adjacent pairs and H=0.5 indicates a completely uncorrelated time series. Researchers have shown their interest in estimating H from ECG time series Song et al. Ref. [10] proposed a method to get information about patient’s emotional state from ECG by estimating H. But no work has been published on detecting CHF from H estimation to the best of our knowledge.
Visibility graph
Lacasa et al. Ref. [17] presented Visibility Graph to convert a time series to a graph. For its simplicity and fast computational power, visibility graph method is very useful to convert a fractal time series into a scale-free graph and its structure is related to the fractality and complexity of the time series. This methodology is reliable and already shows its usefulness in the field of medical and other domains [11-14]. In this method, each sample of the time series is a node of the visibility graph, and an edge between two nodes shows the corresponding time samples that can view each other. Suppose Xi is the ith point of the time series X. Two nodes Xm and Xn are connected through a bidirectional edge if and only if they satisfy the following condition.
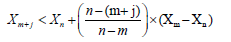
Where

Figure 1 shows an abstraction of converting time series to visibility graph. Two nodes Xm and Xn can see each other, if the above condition is satisfied. It is clear from the Figure 1 that two sequential points of the time series can always see each other. This method is valid for non-negative time series. So, there should be a proper mechanism to map the time series in positive plane if required. According to Graph Theory, number of edges connected to node is the degree of that node. Visibility Graph algorithm has different type of mapping techniques (time series to graph) for different type of time series. Fractal time series is mapped into a scale-free graph which is characterized by where K is the degree of a node,P(k) is the probability distribution of edges distributed in nodes of a graph, and λ is called the power of the scale-freeness of visibility graph (PSVG). PSVG or λ indicates the fractality of the time series, and slope of P (k) versus 1/k in a log– log plane indicates the fractal dimension (FD) of the time series [11,17]. Different published works have shown that fractality of a time series is reflected by visibility graph and λ [13,14]. The present work is devoted to the comparative analysis of the Hurst exponent and the Power of Scale-freeness of Visibility Graph (PSVG) of ECG data for CHF and normal subjects.

Figure 1: Visibility Graph for time series X.
Results
Data
We have taken two different ECG dataset available in MIT-BIH Physionet database [1]. One of them is the BIDMC Congestive Heart Failure Database [25]. It includes long-term RR interval ECG recordings from 15 subjects (11 men and 4 women) with severe congestive heart failure (NYHA class 3-4). Details of this CHF database is described in the report Ref. [15] another one is The MIT-BIH Normal Sinus Rhythm Database [26]. This Normal Sinus Rhythm (NSR) database includes 18 long-term ECG recordings from 18 (5 men and 13 women) subjects. More detailed description about the data is available in the website. We have performed our analysis on these two groups of subjects. The subject names as mentioned here are as described in the physiobank database [1].
Analysis
We have applied the visibility graph analysis technique and Hurst exponent technique in the following way
• Each of the ECG time series is split up for an interval of one minute.
• The Hurst exponent (H) and the PSVG parameter λ are estimated for each time slice using the methods described in Section 2.
Results
A number of interesting observations are obtained after the analysis as described below.
1. The half-hourly mean and standard deviation of Hurst exponents (H) for normal subjects is shown in Figure 2.

Figure 2: Hurst exponent for Normal subjects with half-hourly interval.
2. The half-hourly mean and standard deviation of Hurst exponents (H) for CHF subjects is shown in Figure 3.

Figure 3: Hurst exponent for CHF subjects with half-hourly interval.
3. The comparison of Hurst exponent (H) for normal and CHF subjects with half-hourly mean is plotted in Figure 4.

Figure 4: Comparison of the mean of Hurst exponent between CHF and normal subjects with half-hourly interval.
4. The half-hourly mean and standard deviation of PSVG parameters (λ) for normal subjects is shown in Figure 5.

Figure 5: PSVG for Normal subjects with half-hourly interval.
5. The half-hourly mean and standard deviation of λ for CHF subjects is shown in Figure 6.

Figure 6: PSVG for CHF subjects with half-hourly interval.
6. The comparison of PSVG parameters (λ) for normal and CHF subjects with half-hourly mean is plotted in Figure 7.

Figure 7: Comparison of the mean of PSVG between CHF and normal subjects with half-hourly interval.
Discussion
Discussion of results
The plot of mean Hurst Exponent together with the SD indicates that deviations in Hurst Exponent values from the mean Hurst Exponent are significantly small in normal subjects. Hence it can be concluded that Hurst Exponent values of normal subjects hover around the mean. The Hurst exponent H ≈ 0.5 indicates the uncorrelated behavior of the normal heart signals. This indicates the chaotic behavior of the heart rate dynamics.
Also plot of mean Hurst Exponent together with the SD for diseased subjects indicates that deviations in Hurst Exponent values from the mean Hurst Exponent are significantly small in them as well.
The average value of Hurst Exponent of diseased subjects trends around 0.8 which is well above than that in normal subjects as shown in Figure 4. Value of H>0.5 for CHF subjects indicates the persistent behavior for diseased heart signals. The behavior of normal heart rate time series is more chaotic than the diseased hearts. So, H is very efficient to distinguish the ECG time series of CHF subjects from the ECG of normal subjects.
The non-linearity or chaotic behavior reflected by H and λ are in general a sign of a good health and stable functioning of human heart [27]. Small change in heart rate dynamics can be detected by the λ parameter [28] as well as by H. The diseased (CHF) heart’s ECG is less chaotic than that of the normal heart. Similar analytics when applied to ECG time-series of patients with sudden-cardiac arrests is also reported in Ref. [29].
• All the PSVG λ parameter values of randomly chosen CHF subjects with the mean of half-hourly interval are greater than the mean of all normal subjects as shown in Figure 8.

Figure 8: Comparison of the mean of PSVG parameter among mean of normal subjects with CHF subjects with halfhourly interval.
• Increase in H parameter values or λ parameter values indicate disorder of the heart and the extent of deviation is an indicator of the degree of dysfunction.
We thereby propose a methodology of raising an alarm for CHF subjects according to the behavior of λ, a preview of which can be as below
• Collect ECG data from n number of normal subjects: ECG1, (ECG)2, (ECG)3 … (ECG)n
• Calculate λi for the normal subjects with one minute split up and prepare a bio-maker for normal ECG signals with half-hourly mean c.
• Collect the ECG signal from the subject testing for CHF, ECGt and calculate half-hourly mean of PSVG parameter λti as described above.
• For any λti>λc+ελ where ελ is the tolerance, we can raise an alarm for Congestive Heart Failure.
• In a similar manner, increase in Hurst exponent H values from a pre-defined normal value may be used to trigger alarm for Congestive Heart Failure.
• Hurst exponent H is used to determine the chaotic behavior or nonlinearity of any time series and PSVG parameter λ measures the nonlinearity. PSVG parameter λ is more effective for determination of anomaly in cardiac behavior as PSVG values are an order higher than H parameter values and hence difference is easier to detect.
Conclusion
The Η and λ values reflect the chaotic behavior of heart rate signals. Computational values of Η and λ parameters from ECG data may be put to use in the following ways:
• This method can be implemented in any Java based devices as well as in mobile apps. One requires to have pre-computed biomarkers for healthy hearts and they can perform self-checkup from their ECG data.
• CHF patient can check the improvement of the heart periodically with lifestyle modification and medication.
• It is low cost and non-invasive detection for CHF.
In short the present analysis distinctively indicates the use of the parameter Η and λ in the analysis of cardiac data for CHF subjects, and can serve as a novel and useful clinical tool for risk stratification.
Acknowledgements
We thank the Department of Higher Education, Government of West Bengal, India for providing us the computational facilities to carry on this work. We also thank Nilanjana Pal Choudhury and Shiraz Ray for helping us in preparation of this manuscript.
Statement of Competing Interests
The authors report no competing interests.
References
- Goldberger AL, Amaral LAN, Glass L (2000) PhysioBank, PhysioToolkit, and PhysioNet: Components of a New Research Resource for Complex Physiologic Signals. Circulation 101: e215-e220.
- Hosenpud JD, Greenberg BH (2007) Congestive Heart Failure. New York: Lippincott Williams and Wilkins.
- Chronic Heart Failure (2010) National Clinical Guideline for Diagnosis and Management in Primary and Secondary Care: Partial Update.
- Wang TJ, Evans JC, Benjamin EJ, Levy D, LeRoy EC, Vasan RS (2003) Natural history of asymptomatic left ventricular systolic dysfunction in the community. Circulation 108: 977-982.
- Bui AL, Horwich TB, Fonarow GC (2011) Epidemiology and risk profile of heart failure. Nat Rev Cardiol 8: 30-41.
- DworzynskiK, Roberts E, Ludman A, Mant J (2014) Guideline Development Group of the National Institute for Health and Care Excellence. Diagnosing and managing acute heart failure in adults: summary of NICE guidance. BMJ 349: 56-95.
- Hunt SA, Abraham WT, Chin MH(2005) ACC/AHAGuideline Update for the Diagnosis and Management of Chronic Heart Failure in the Adult: a report of the American College of Cardiology/American Heart AssociationTask Force on Practice Guidelines (Writing Committee to Update the 2001 Guidelines). Circulation 112: e154-e235.
- Association NYH (1994) Classification of Functional Capacity and Objective Assessment.
- Rosamond W, Flegal K, Furie K (2008) Heart Disease and Stroke Statistics--2008 Update: A Report from the American Heart Association Statistics Committee and Stroke Statistics Subcommittee. Circulation 117: e25-e146.
- Song R, Bian C, Ma QDY (2013) Multifractal analysis of heartbeat dynamics during meditation training. Phys A 392: 1858-1862.
- Lo MT, Tsai PH,Lin PF, LinC, Hsin YL (2009) Nonlinear and Nonstationary Properties in Eeg Signals: Probing the Complex Fluctuations by Hilbert-Huang Transform. Adv Adapt Data Anal 01: 461-482.
- Ho YL, Lin C, Lin YH, Lo MT (2011)The prognostic value of non-linear analysis of heart rate variability in patients with congestive heart failure--a pilot study of multiscale entropy. PLOS One 6: e18699.
- Goldberger AL, Amaral LAN, Hausdorff JM, Ivanov PC, Peng CK, et al. (2002) Fractal dynamics in physiology: Alterations with disease and aging. Proc Natl Acad Sci 99: 2466-2472.
- Peng CK, Costa M, Goldberger AL(2009) Adaptive Data Analysis of Complex Fluctuations in Physiologic Time Series. Adv Adapt Data Anal 01: 61-70.
- Sarkar A, Barat P (2008) Effect of Meditation on Scaling Behavior and Complexity of Human Heart Rate Variability. Fractals 16: 199-208.
- Conte E, Khrennikov A, Federici A, Zbilut JP (2009)Fractal fluctuations and quantum-like chaos in the brain by analysis of variability ofbrain waves: A new method based on a fractal variance function and random matrix theory: A link with El Naschie fractal Cantorian space-time and V. Weiss and H. Weissg golden ratio in brain. Chaos, Solitons and Fractals 41: 2790-2800.
- Lacasa L, Luque B, Ballesteros F, Luque J, Nuño JC (2008) From time series to complex networks: the visibility graph. Proc Natl Acad Sci USA 105: 4972-4975.
- Lacasa L, Luque B, Luque J, Nuño JC (2009) The visibility graph: A new method for estimating the Hurst exponent of fractional Brownian motion. EPL (Europhysics Lett) 86: 30001.
- Simonsen I, Hansen A, Nes OM (1998) Determination of the Hurst exponent by use of wavelet transforms. Phys Rev E 58: 2779-2787.
- Kantelhardt JW, Zschiegner SA, Koscielny-Bunde E, Havlin S, Bunde A, et al. (2002) Multifractal detrended fluctuation analysis of nonstationary time series. Phys A Stat Mech its Appl 316: 87-114.
- Mandelbrot BB, Van Ness JW (1968) Fractional Brownian Motions, Fractional Noises and Applications. SIAM Rev10: 422-437.
- Kotecha D, Holmes J, Krum H (2014) Efficacy of β blockers in patients with heart failure plus atrial fibrillation: an individual-patient data meta-analysis. Lancet (London, England) 384: 2235-2243.
- La RMT, Pinna GD, Maestri R (2003) Short-term heart rate variability strongly predicts sudden cadiac death in chronic heart failure patients. Circulation 107: 565-570.
- Poon CS, Merrill CK (1997) Decrease of cardiac chaos in congestive heart failure. Nature389: 492-495.
- The BIDMC Congestive Heart Failure Database.
- https: //physionet.org/physiobank/database/nsr2db/
- Peng CK, Mietus JE, Liu Y (1999) Exaggerated heart rate oscillations during two meditation techniques. Int J Cardiol 70: 101-107.
- AnirbanB, Ghosh D (2016) Quantitative Assessment of Heart Rate Dynamics during Meditation: An ECG Based Study with Multi-Fractality and Visibility Graph. Front Physiol 7: 1-10.
- Nilanjana P, Anirban B, Susmita B, Dipak G (2016) Non-invasive alarm generation for Sudden Cardiac Arrest - a pilot study with visibility graph technique. Transl Biomed 7: 3.

Open Access Journals
- Aquaculture & Veterinary Science
- Chemistry & Chemical Sciences
- Clinical Sciences
- Engineering
- General Science
- Genetics & Molecular Biology
- Health Care & Nursing
- Immunology & Microbiology
- Materials Science
- Mathematics & Physics
- Medical Sciences
- Neurology & Psychiatry
- Oncology & Cancer Science
- Pharmaceutical Sciences